Predictive analytics and Statistics are two of the techniques to be utilized for data analytics. Analytics is the combination of data, machine learning, statistical analysis, and mathematical or computer models to carry out the data-to-action process by analyzing and understanding in context. Data analytics leverages predictive statistical analysis to obtain game-changing data related to future events. Analytics contributes to better understanding and better decision-making.
There are several types of analytics: descriptive analytics, predictive analytics, and prescriptive analytics. Out of these three types of analytics, this article focuses on predictive analytics. Whereas statistics is the mathematical calculation of data to analyze, interpret, and identify correlations.
Today the focus will be on the difference of predictive analytics vs statistics as well as their correlations.
Predictive analytics vs statistics
Predictive analysis interprets historical and present situations so that data can be analyzed in the
future using various statistical methods such as data mining, forecasting, and machine learning.
Let’s get familiar with some terminology:
- Data mining is the process of discovering insights in large data sets.
- Forecasting is the method by which trends that will dominate the market in the future are identified through the use of past data and analysis.
- Machine learning is concerned with building algorithms for classification, prediction, and optimization using statistics, mathematics, and computer science basics.
- The purpose of predictive analysis is to derive useful information from data to predict future or other unknown events.
Source: Unsplash
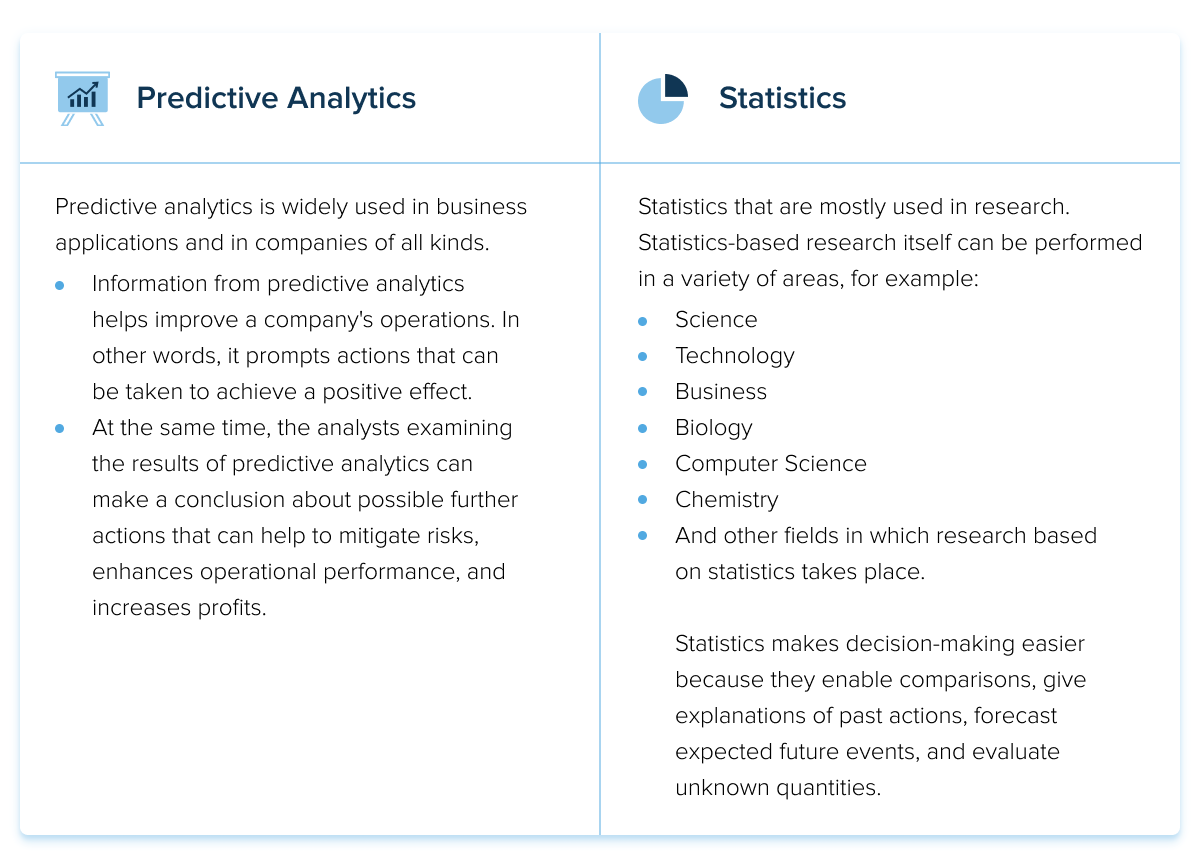
Statistics is the science of collecting, classifying, and presenting numerical data or in simpler words, it is the collection of numerical facts. How statistics are different from predictive analytics can be viewed from several perspectives: importance, relation, methods and techniques, and area of use.
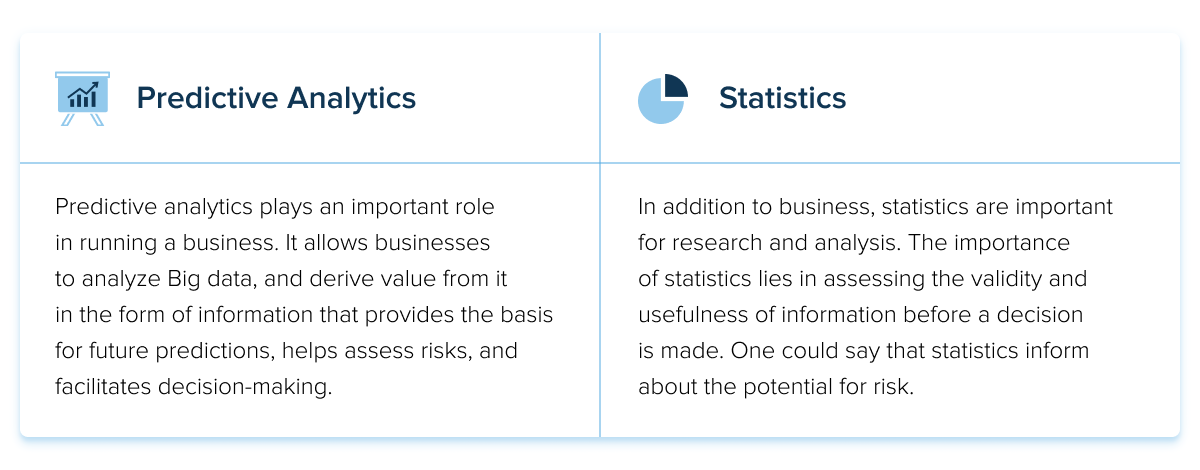
Importance of predictive analytics and statistics
The relation between predictive analytics and statistics

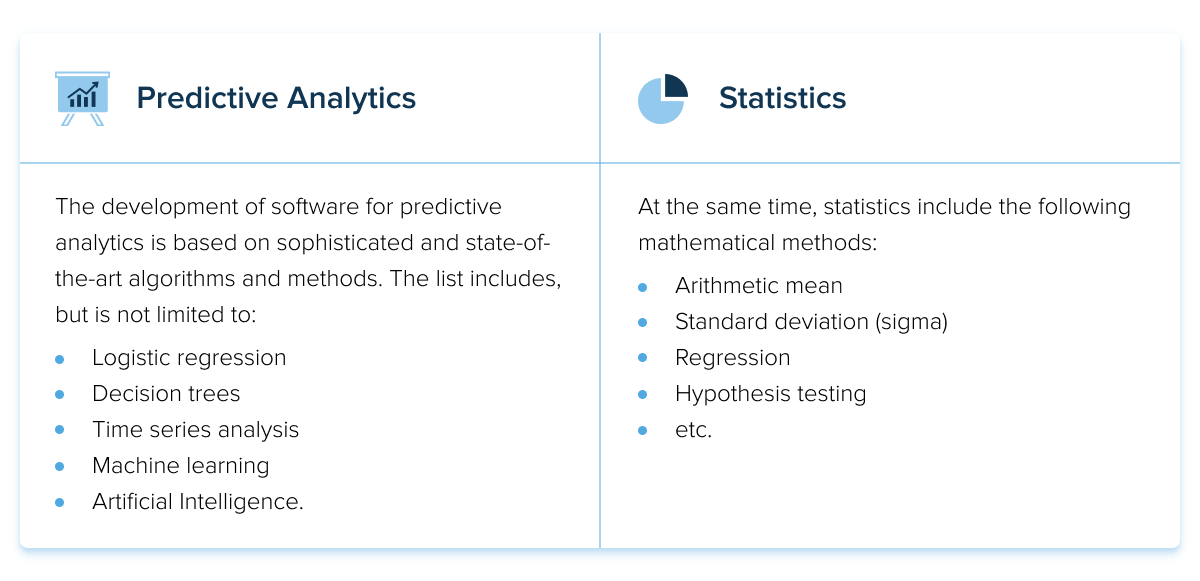
Methods and techniques used in predictive analytics and statistics
Where predictive analytics and statistics can be used
Predictive and statistical modeling
Predictive modeling is a critical component of predictive analytics. Predictive modeling refers to the process of using statistical analysis, machine learning, and predictive modeling to predict likely activity, behavior, and trends based on current and past data.
Predictive analytics includes various statistical methods:
- Data mining: searching for patterns and relationships in large data sets.
- Text analytics: obtaining analyzable organized data from non-structured text.
- Predictive modeling: building and adjusting a statistical model to forecast upcoming events.
A unifying factor is a fact that the same methods work for statistics as for predictive analytics. For predictive analytics statistical models can be used. In addition, statistics help to build a predictive model to anticipate results. That is why this section is called predictive statistical modeling.

Source: Unsplash
Let’s take a look at what predictive analytics statistical models exist:
1. Classification model
Let’s start with the most popular model, the classification model. A classification model divides historical data into categories through analysis. Classification models are customizable and useful in all business sectors because this model presents useful and detailed information that helps businesses create appropriate solutions.
2. Clustering model
The point of the clustering model is to collect data and divide it into groups based on shared characteristics.
Clustering comes in two types:
- Rigid clustering facilitates data classification. This model determines whether each data point belongs to a cluster.
- Soft clustering is more complex. It assigns a certain probability to each data point.
The clustering model is used in marketing for campaigns targeting specific customer groups.
3. Outlier model
The outlier model detects anomalous data elements in a data set that may exist either on their own or together with other categories and numbers. In industries such as retail and finance, the use of emission models can save companies millions of dollars. Emission models, by quickly identifying anomalies, make predictive analytics effective for detecting fraud.

Source: Unsplash
4. Forecast model
Forecasting models drive the metric value forecasting by calculating new data values derived from historical data. Prediction models also produce numerical values in the historical data if none are found. Prediction models can handle multiple metrics at once. Many different business objectives are served by such models.
5. Time series model
Time series prediction models analyze data sets where the input parameter is a time sequence. A time series model develops a numerical value that predicts trends over a particular period by combining multiple data points (from the previous year’s data).
Depending on the needs of the organization, the model can predict several regions or projects at once or focus on a single area or task. If an organization needs to know how a particular variable changes over time, a time-series model is the best solution.

Source: Unsplash
6. Decision trees model
Decision trees are one of the most popular statistical methods in predictive analytics. Decision tree algorithms take data and line it up in branches to determine a course of action or to show statistical probability.
The branches indicate available choices, and the individual leaves represent a particular decision. The branching method can also show all the possible outcomes of a particular decision and how one choice might lead to the next. Decision trees can be used with incomplete data sets.
7. Neural networks model
Neural networks are algorithms designed to reveal underlying relationships in a data set by simulating the workings of the human mind.
Neural networks are at the heart of many modern examples of artificial intelligence (AI). This model can handle complex data relationships using artificial intelligence and pattern recognition, including image recognition, intelligent assistants, and natural language generation.
8. Regression model
Regression is a type of predictive statistical model that analyzes the relationship between two variables: dependent and independent.
There are three types of regression models: logistic regression, polynomial regression, and linear regression. The regression model is used for forecasting, modeling time series, and identifying causal relationships between variables. Regression methods are often used in banking, investing, and other finance-oriented fields.

We can apply virtually any statistical model for predictive analytics. The most commonly used predictive analytics statistical models are the classification model, clustering model, outlier model, forecast model, time series model, decision trees model, neural networks model, and regression model.
Statistics for predictive analytics
Statistics is an area of mathematics that deals with derivatives and probabilities derived from data. Statistics play an important role in predictive analytics since it is the analysis and representation of numerical data facts and serves as the basis for all data mining and machine learning algorithms. At the same time, along with data mining and machine learning, statistics is a component of predictive analytics.
Statistics are very important in data-driven research because they help:
- Determine the type of data needed to solve a particular problem
- Organize and summarize data
- Conduct analyses to draw conclusions from the data
- Make predictions based on statistical data
- Evaluate the effectiveness of results and assess uncertainty.
In addition, statistics provide a methodology for collecting, analyzing, and drawing conclusions from data. Through statistics, predictive analytics can use the following methods:
- Design for planning and conducting research
- Descriptions that involve examining and summarizing data
- Creating predictions and conclusions using the phenomena represented by the data.

Source: Unsplash
Statistics uses probability, survey design, and experimentation to obtain the desired outcome or quantify the data. The usage of statistics to predict is also powered by various statistical tools. The list of statistical tools for predictive analytics includes:
- SAP Analytics;
- IBM SPSS;
- Alteryx;
- H2O;
- RapidMiner Studio;
- KNIME Analytics Platform;
- SAS Advanced Analytics;
- TIBCO Statistica.
Statistics is used in the following spheres:
- Commerce and trade
- Industry
- Population studies, economics
- Psychology
- Biology and physical sciences
- Astronomy, etc.
Predictive analytics top use cases in 2023
Predictive analytics estimates the probability of future outcomes and alerts you to upcoming events to help you make decisions. Predictive analytics, or rather the result of its application, can change the way organizations make decisions.
For instance, predictive analytics in personalized care can improve treatment and healthcare services. Therefore, it is considered a powerful tool and is used in industries and activities, including but not limited to the following areas:
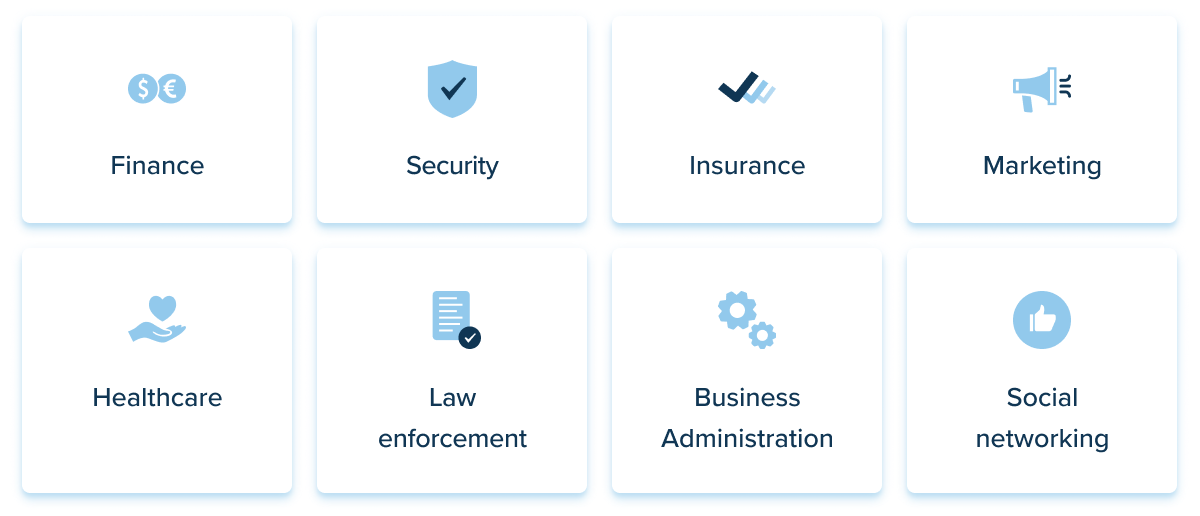
The reason why predictive analytics has become accepted in a wide range of fields is because of the usefulness it brings as a result of analyzing the target consumer for operational results.
Let’s take a look at what predictive analytics can be used for in 2023.
Impact on customer churn
Predictive analytics is used to study customer behavior and identify the moments when a customer decides to leave.
In addition, predictive analytics helps analyze current customer dissatisfaction and identify customer segments most at risk of leaving. By knowing the reasons why customers leave, businesses can prevent them and thereby retain customers. Retaining an old customer is less costly than attracting new ones. Therefore, with predictive analytics, businesses can maintain revenue.

Source: Unsplash
Use areas: Banking, Telecom, Insurance, Retail, Social Networking, etc.
Customer lifetime value
Identifying and retaining a customer who tends to spend large amounts of money sequentially over a long period of time is an extremely difficult task for businesses. With predictive analytics, however, it is possible. Predictive analytics provides the business with information about such customers and specifies the total revenue that the business can expect from such a customer.
With this data, businesses can effectively tailor their marketing campaigns, and re-evaluate the services they offer, focusing on this type of customer with the most significant lifetime value.
Use areas: Banking, Telecom, Insurance, Retail, etc.
Facilitates customer segmentation
Customer segmentation is the division of customers into groups based on common characteristics. Segmentation is used in business to gain a deeper understanding of customers and to improve the target offer.
Predictive analytics is used for customer segmentation to analyze the segments of those who are most interested in the offer and shape the offer by targeting a particular segment based on accurate insights and metrics.

Source: Unsplash
In this way, the business can create an offer that will be able to meet the demand of each customer group, which in turn will contribute to increased sales. In addition, customer segmentation with predictive analytics can reveal to the business a group of target customers that may not have been previously known.
Use areas: Retail, Insurance, Telecom, Banking, Automotive, Pharmaceutical, etc.
Equipment maintenance prediction
Revenue growth depends not only on incoming profits but also on maintaining costs. Predictive analytics is a budget saver for businesses that have to invest heavily in equipment and infrastructure.
Predictive analytics collects data from equipment, and equipment data, to predict when maintenance is needed and thereby avoid lost revenue and dissatisfied customers. The more data we have, the more accurate the predictions will be.

Source: Unsplash
Predictive analytics software uses statistics to gather information about the next maintenance so that businesses can allocate budgets more efficiently without having to worry about sudden surprises from equipment.
Use areas: Telecom, Pharmaceutical, Automotive, Logistics & Transportation, Utilities, Manufacturing, etc.
Better quality assurance
A satisfied customer tends to buy more and tends to come back. Quality is one of the most important criteria for customer satisfaction. In addition, effective quality control will affect revenues and market share.
Predictive analytics helps identify quality problems early on. By means of that, the enterprise, having reacted in time and made changes to the existing processes in order to increase productivity, prevents the problem from increasing to a critical level.

Use areas: Manufacturing, Pharmaceutical, Automotive, Utilities, etc.
Risk and fraud prediction
Predictive analytics has many applications for risk and fraud prevention. Predictive analytics identifies anomalies, atypical behavior, and patterns in the system. This, in turn, facilitates rapid response times.
Let’s look at how this works with an example: banks track a customer’s spending patterns along with their whereabouts, so when abnormal patterns of client activity emerge in the systems, the bank and the customer can be alerted. The underlying idea behind this procedure is the use of predictive AI. It restricts hacker infiltration and vulnerabilities that could put the system at risk.
Use areas: Banking, Telecommunications, Insurance, Social Networking, etc.
Cross-selling and upselling
Cross-selling works by understanding which additional products a customer is likely to buy based on statistics and predictive analysis. Upselling is motivating a customer to spend more money on a more expensive version of a product.

Source: Unsplash
Predictive analytics, in this case, deals with the customer’s profile, purchase, and browsing history and, based on that, forecasts the potential demand, i.e. what else the business can offer the customer. It would be needless to say that this increases sales.
Use areas: Banking, Retail, eCommerce, Telecom, and Insurance.
Summing up
Businesses now have access to an immense amount of data that includes, but is not limited to customers and their purchases, employees and their locations, equipment and its condition, competitors, and much more.
The same type of analytical data can be used to predict election results, weather forecasts, disease transmission, and progression. Predictive analytics is the business of predicting the future based on analytical data. Whereas Statistics is a gathering of numerical facts. Both statistics and predictive analytics are used to analyze data. While there are differences between predictive analytics and classical statistics, they are still very much interconnected. Comparison of statistics and predictive analytics is possible according to the following criteria: importance, relation, methods and techniques, and area of use.
When it comes to applying predictive analytics and statistics to business, they both facilitate decision-making and make it more efficient. The combination of statistics and predictive analytics is a powerful tool for decisions regarding the future.
Predictive analytics can be used for banking, insurance, telecom, social networking, and medicine as well as for retail and E-commerce, etc. Being used in these spheres it serves a massive number of purposes and brings value to businesses.
Data-driven insights with the help of predictive analytics
Looking for a reliable predictive analytics company to help you with a data project? Contact us, and our consultants will reach out to you for a discussion of your project.
