
In 2026, the success of most businesses depends on how well they can organize and interpret their data. The faster they do it, the quicker they can make decisions; the more accurate their interpretations are, the more efficient choices they make.
With AI-powered applications, working with data has become simpler than ever. Businesses now have access to powerful analytics tools that turn complex datasets into clear, actionable insights—enabling smarter decisions, faster growth, and measurable outcomes.
Data analytics has shifted from a technical function to a core business driver. Whether you’re tracking sales performance, forecasting demand, or monitoring customer behavior, the ability to visualize and interpret data in real time gives companies a significant competitive edge.
Tools like Power BI fit naturally into this landscape—translating raw data from spreadsheets, databases, and other sources into interactive dashboards with charts, KPIs, and tables. But the real question isn’t about the tool itself. It’s about what automated reporting can do for your business — and how to make it work for you.
Find answers to these questions in the guide below. Most importantly, check how predictive and descriptive analytics can help your business grow and what the future holds for the field of data-based work.
Why descriptive and predictive analytics drive business growth
Predictive analytics plays a big role in helping businesses function. Instead of merely describing the facts and data, it helps calculate which scenarios are more or less likely and which actions can lead to which outcomes.
Here are three of the most common examples of its usage:
- Demand forecasting. The demand fluctuates based on the season, market trends, and many other factors, and predicting it correctly means producing the right amount of goods.
- Customer retention. Churn patterns can indicate which customers are becoming the flight risk, letting businesses prepare a countermeasure plan in advance.
- Financial planning. Predictive models help anticipate cash flow challenges, enabling businesses to prepare for liquidity challenges before they occur.
However, there is also descriptive analytics. It serves two key goals that we are going to review below.
Optimizing operations
Descriptive analytics allows managers to monitor business performance across multiple departments at once. How does this help them? They can notice problems and inefficiencies right away; in turn, this enables them to optimize operations by implementing effective counter strategies.
Everything, from marketing automation to the data engineering tasks, can become much simpler with the right solutions. Here are the specific examples of how descriptive analytics help businesses grow:
- Supply chain optimization. Analytical tools can quickly reveal delays in logistics: this helps companies redesign distribution routes efficiently on the first try.
- Workforce productivity. By employing descriptive analytics, it’s easy to notice which employees perform well and whose metrics drop below the acceptable level.
- Marketing ROI. Analytical monitoring can show which channels bring the biggest profit; this helps with smarter budget allocation.
By visualizing KPIs and operation-related trends, businesses can identify inefficiencies and bottlenecks. This allows them to make quick decisions and allocate their resources in more productive ways.
Driving measurable business outcomes
Businesses that use descriptive analytics find it easier to make decisions that can actually be measured in terms of their efficiency. Here are some examples.
- Revenue growth. When done by experts who use the right tools, analytical monitoring can provide insights into the most profitable customer segments. It allows segmenting sales data, visualizing customer behavior, and highlighting which products and regions deliver the biggest revenue.
- Cost reduction. Analytics help track operational KPIs and make inefficiencies visible: this helps companies reduce their costs by reallocating resources, retraining less efficient employees, and renegotiating contracts.
- Risk mitigation. Suspicious patterns in financial data become obvious when historical data is summarized; with descriptive analytics, experts can integrate these insights into comprehensive reports, allowing safety teams to act faster.
Power BI can be of help here. While big businesses tend to hire data warehouse consultants to advise them and help them understand their data, BI reports form the foundation of work for every party. With their help, businesses can predict the demand, track operational efficiency, and reduce their costs in no time.
Why people need data analytics automation
Each automated Power BI report has a dashboard illustrating its contents. In this context, a dashboard means a single-page view that shows the most important visuals from your report. Just one look, and you’ll see all the key data sitting neatly in one place. The examples of the best Power BI dashboards can show you what metrics you should prioritize and which type of structure to follow. The better organized your dashboard is, the more effective it will be.
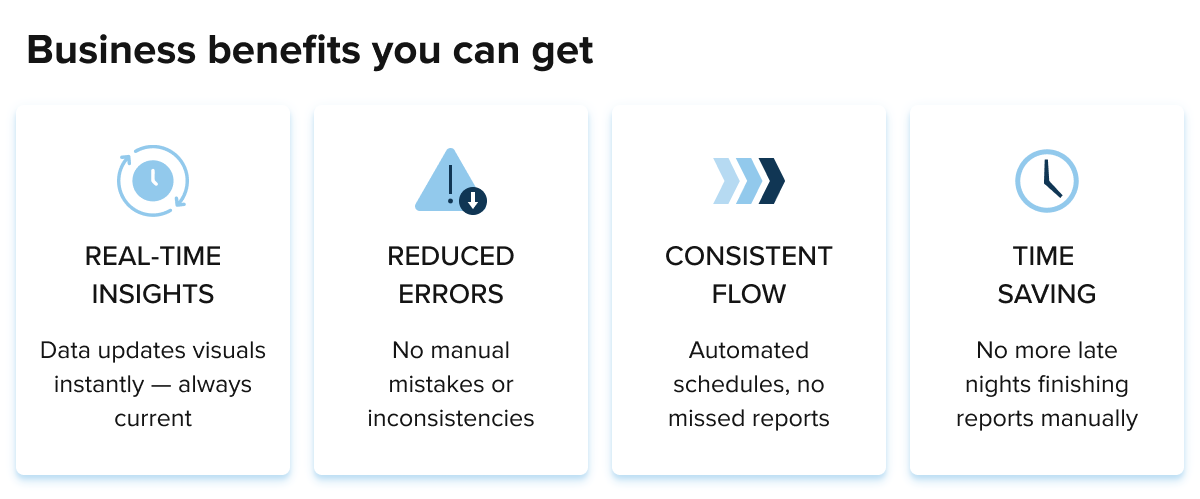
Now, let’s see the key benefits of report automation in Power BI.
- Real-time insights. When data is updated, your visuals get updated as well, and it happens in real time. It means that your numbers will always stay relevant, and you won’t have to do manual checks again and again.
- Reduced errors. When you compile reports manually, you are almost guaranteed to make mistakes, which can lead to a whole range of inconsistencies; automating your BI reports can take care of problems like these.
- Consistent flow. Automation creates consistent schedules, so people don’t have to worry about being late with their reports, forgetting about them, or skipping a vital source of data.
- Time-saving. All the listed benefits can save time to a huge extent: people automating their Power BI can skip the unpleasantries like staying up all night to finish a report.
These benefits are exactly why more and more businesses choose to automate their reports with Power BI. It makes their jobs easier, clearer, and much more comprehensive.
See business intelligence use cases to get an even clearer idea of how you, in particular, can win from automation. The more you understand about the reports generated by unique tools, the more opportunities you will gain, as no benefit will slip beyond your notice.
How to create a Power BI report automatically
Automating a Power BI report doesn’t require deep technical expertise, but it does involve a few key stages. Some companies choose to work with Big data development partners to get not just automated reports, but human insights they can actually act on. For those who prefer to handle it in-house, here’s what the process generally looks like.
It starts with connecting your data sources — whether that’s Excel spreadsheets, Google Analytics, a database, or another platform. From there, the data typically needs some cleaning and structuring before it’s ready to be visualized: removing inconsistencies, standardizing formats, and filtering out irrelevant entries.

Source: Unsplash
Once the data is in good shape, the next stage is building out the report itself — choosing the right charts, tables, and KPIs, and organizing them into clear, readable pages. The final step is publishing the report to a shared workspace, making it accessible to whoever needs it across the organization.
This workflow applies across virtually every industry. In marketing, for example, automated reporting through tools like Power BI makes it much easier to track campaign performance and spot trends in real time. In finance, where reporting demands are high and errors are costly, automation removes a significant manual burden. The same logic holds regardless of the sector — when reports run themselves, teams spend less time compiling data and more time acting on it.
The role of data culture in business growth
Having the right tools is great, but there is one problem companies often face, and that’s employee ignorance toward what is available and what they can do. Every person within a successful business setting has to embed a data-driven approach into their inherent way of thinking.
Think about it: what departments usually handle the reports and all the data they come with? In most cases, it’s IT or data analytics teams. That seems like an obvious order of things, but in 2026, each employee and every leader must have access to all kinds of information. Unless you’re dealing with top-secret tasks, cultivating a healthy data culture is a way for your business to thrive.

Source: Unsplash
Why? Because such democratization makes everyone feel involved on a deeply personal level. It encourages creativity and independence, fosters innovations, and strengthens one’s sense of accountability.
How to know if your business has a healthy data culture? Consider these indicators:
- Data independence. Staff at all levels should be able to review relevant reports instead of simply relying on analytical teams’ conclusions.
- Collaborations. If your business has regular collaborations between different departments, it’s a good sign.
- Trust in data quality. Businesses with an established data culture don’t have teams upon teams of data reviewers or a sea of AI evaluation tools; they trust the information their employees deliver from the first go.
- Data literacy programs. While this is an optional attribute, it’s a good thing for businesses to launch data literacy programs that educate all their employees on relevant tools and analytical concepts.
Companies that adopt a healthy data culture tend to react to client demands more effectively, adapting to changes faster and outperforming those businesses that wallow in data segregation.
Future evolution of data analytics
The business intelligence app market is predicted to grow by 14.98% annually. The existing tools already offer a huge number of benefits to businesses, and in the future, we can expect them to become even more advanced. This is how they can support future analytics trends:
- Integration with IoT. Real-time analytics will gain more relevance: businesses will require tools that can stream IoT data right into live dashboards, demonstrating logistics flows, equipment performance, etc.
- Self-service tools. At the moment, some non-technical users still find it challenging to use the existing analytics tools; their interface will become more intuitive in the near future, so more people will be able to build and customize the way relevant insights are displayed.
- Natural language queries. Various analytical tools already support natural language, but these capabilities are bound to grow more precise. It’ll be enough to type a string of keywords like “report Kenya last quarter,” and a tool like Power BI will show you visualized answers.
- AI agents represent perhaps the most significant shift on the horizon. Rather than waiting for a user to ask a question, AI agents will proactively monitor data, surface anomalies, generate reports, and even trigger actions — all autonomously. Businesses will move from reactive dashboards to intelligent systems that continuously analyze data and recommend next steps without any manual prompting.
The market is becoming more and more data-driven, so businesses that simplify their work by using the right tools will have a bigger chance to boost their efficiency.
Use analytical tools and focus on flows that matter
Both predictive and descriptive analytics are essential for every business endeavor. The former needs statistical models and machine learning: experts can gather historical data and see what changes and outcomes they should expect to see in the future. The latter focuses on summarizing the data, so businesses can study reports and dashboards and make real-time conclusions.
With the introduction of countless useful analytical and reporting tools like Power BI, modern companies have a much bigger chance to simplify their daily operations. Gathering data across all the departments, identifying trouble before it has a chance to blossom, making fast decisions, and reaching the maximum level of efficiency: the capabilities of AI-powered tools make it all possible.
Follow the recommendations of the best BI implementation services. Things might look challenging and overwhelming at first, but you will get used to it quickly, especially if you’re used to working in a data-driven environment.
Use BI reports as part of Big data analytics solutions, strengthening your business and accelerating your problem-solving. Look for other tools that are relevant for your specific niche, and as long as you have access to the freshest data, you’ll excel at faster and more efficient decision-making.