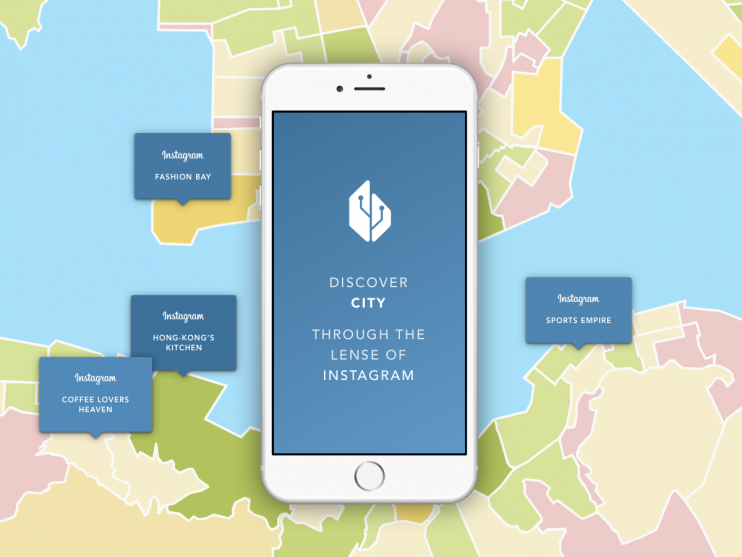
InData Labs with support of Datasia.hk presents interactive map of Hong Kong that contains data visualization of all the Instagram activity of the city. The map is telling a story about life in Hong Kong, by showing who posts what and from which locations.
‘The research is unique because it’s the first and the only one that defines demographic characteristics and income rate of Instagram users in Hong Kong,’- says Sergey Enin, Director of Technology Solutions at InData Labs.
Why the map matters?
Today’s consumers are more informed and connected than ever before. They are not attracted by conventional ads any more, instead they turn to social networks in order to get inspiration, advice or approval for buying a new product. Data visualization solution we provide opens windows into people’s everyday lives by gathering, analyzing and visualizing tons of social media data on a single map.
‘In the era of social media brands should rethink the way they interact with their customers. Equipped with geo-social insights marketers will be able to reach their customers with a relevant and consistent message, at the right time. This is why we are quite confident about the value of our solution,’ – says Ilya Kirillov, InData Labs CEO.
The map depicts that Instagram like any other social network is a reflection of people’s real life. For example, on the map you can see that sports brand Nike is more frequently mentioned in Yuet Wah, Tai Koo Shing East, Shek Wai Kok, the districts where major sport venues are located and where people go in for sports every day. If you are able to embrace social media data, than you will have a better understanding of life that is happening out there.
Technology behind data visualization on the Map.
More than 1.5 million Instagram posts have been gathered to create this interactive infographics. All of the posts are geo-tagged so that mapping them out was possible.
The colors on the map show density and sentiments of Instagram posts across Hong Kong.
The most Instagram-active Hong Kong districts according to the research are:
- Chung Wan – 140 731 posts
- Oi Kwan – 98 018
- Tsim Sha Tsui East – 92 519
- Tsim Sha Tsui West – 78 097
- Airport – 68 895.
With Chung Wan being the most positively- and Airport being the most negatively-tuned locations in Hong Kong. (Negative doesn’t mean aggressive or impolite, negative posts more often express sadness or disappointment.)
At the beginning the map was called ‘Hong Kong happiness map’ as it visualized sentiment of Instagram posts across Hong Kong. But step by step more social media insights were added.
‘Now looking at the map is like listening to ‘Instagram heartbeat’ of the city. The map reflects life of Instagrammers in so many details that after a certain customization it can be used as a source of location-based insights to enable geo-targeting,’ – says Irina Peregud, Marketing Manager at InData Labs.
1. Most Popular Brands in Hong-Kong
As part of the research InData Labs extracted the most popular topics on Hong Kong’s Instagram. Thus the most popular Brands in Hong Kong were defined and added to the map.
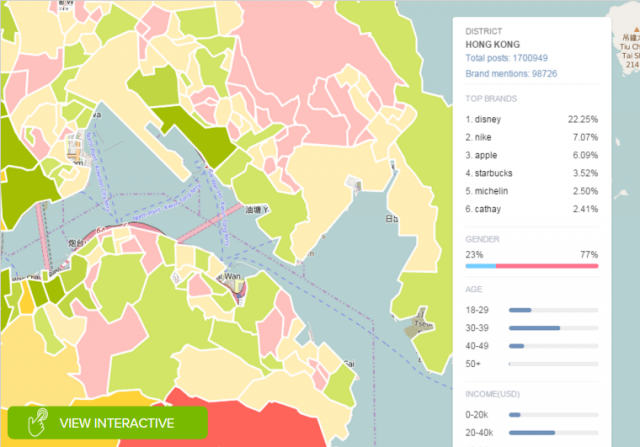
According to the research, brands that were mentioned most frequently in Hong Kong are:
- Disney
- Nike
- Apple
- Starbucks
- Michelin (referring to Michelin-starred restaurants)
2. Demographics of Instagram Users
Diagrams on the right show statistics on age, gender and income rate of Instagrammers.
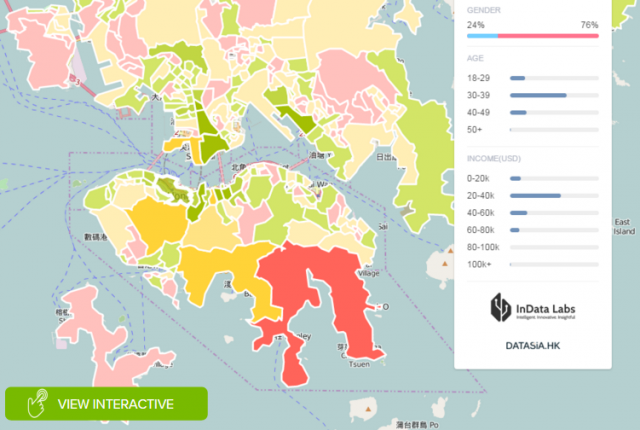
All the data was predicted by InData Labs proprietary algorithms. Navigating the map you can see how the list of top brands and statistics vary from district to district.
3. Filters
Applying filters on the top left corner you can choose the demographic group that you are most interested in.
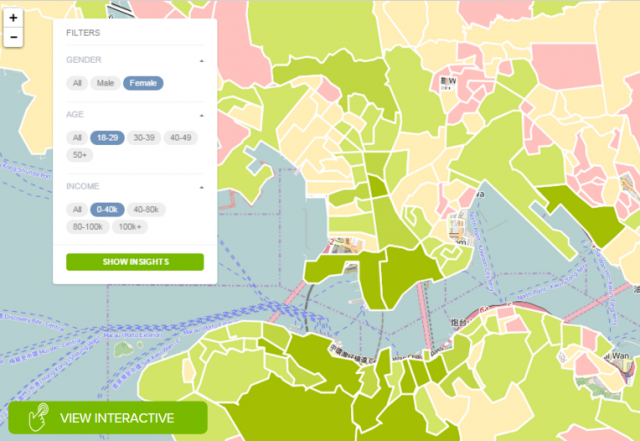
Applying various filters, you can learn a lot about hong-kongers. E.g. Where young and wealthy people spend their time and what brands they are attracted by? Where people prefer Nike over Adidas and vice versa? Which demographic segment is the most positive in Hong Kong and if higher salary means more happiness? The map can provide answers to these questions and many others. Give it a try right now!
For more information about InData Labs data visualization solutions, please email us at info@indatalabs.com.
Using machine learning (ML), AI and Big Data technologies InData Labs helps tech startups and enterprises explore new ways of leveraging data, implement highly complex and innovative projects, and build breakthrough AI products. Our core services include Data Strategy Consulting, Big Data Engineering, Data Science Consulting.