Sales performance analytics is quite a frightening term. Upon hearing it, people imagine impossible numbers and weird formulas, countless spreadsheets and innumerable graphs, and they get very easily intimidated.
However, what if we told you sales performance management isn’t such a boogeyman as many make it out to be. In fact, it is much simpler, and thanks to sales performance management software, all those graphs and spreadsheets seem much less intimidating.
And that’s what we’re here to do today. We’re here to dispel the myths around sales analytics by providing you a deep insight into the activities undertaken, metrics evaluated, and considerations made in order to keep a business afloat with said analytics. Let’s go!
Sales performance management and sale analytics – what is it?
Sales performance management or sales analytics is the act of analyzing sales data in numerous ways in order to predict future sales trends and allow a business to act accordingly.
As we said, sales analytics isn’t a monolithic discipline but consists of many different considerations and metrics, all working together to form an accurate picture of your business’s sales performance for a given period.

Source: Unsplash
And as E-commerce continues to become the dominant form of commerce, sales, and data analytics, in general, are becoming an ever more important factor in keeping businesses afloat.
Fortunately, there are plenty of firms out there offering their expertise in the field. Combined with new technologies in the field of AI learning and Big data analytics employed more and more in modern companies, these experts are able to predict the flow of the market with astounding accuracy.
Data-driven: how performance analytics delivers extraordinary sales results
The key to analytics is, of course, data. Without data, one cannot paint an accurate picture of their sales performance and, thus, risk losing sales and losing revenue.
However, there are a number of data points one can exploit. As we said, data analytics isn’t a singular practice with an all-encompassing method. Instead, it is segmented into those aforementioned data points, thus giving rise to a number of metrics that ought to be monitored and analyzed.
Sales performance predictive analytics: metrics
Let’s take a look at the most important sales performance metrics to take into account.
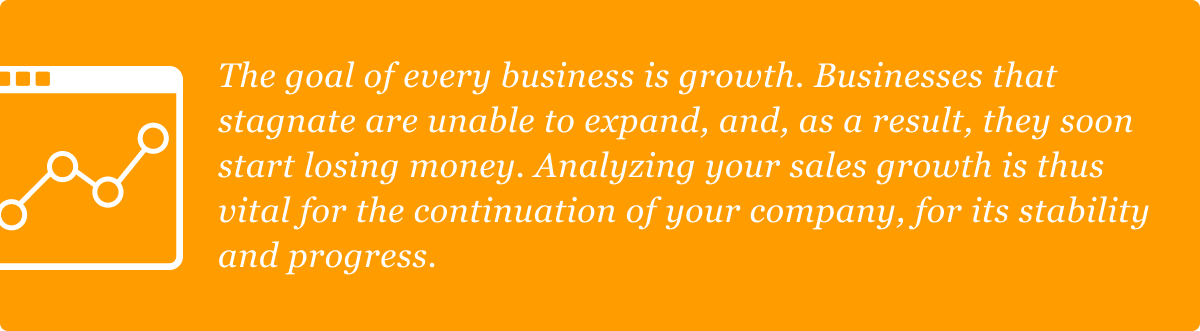
Sales growth
One of the most important metrics for your business’s sales performance is the sales growth metric.
To calculate this metric, you need to subtract the sales from your previous period from the sales of the current period, then divide the number again by the first figure, then multiply by 100.
Sales target
Sales target is a metric focusing on your long-term goal. Your sales target can be a certain revenue figure, a sales figure or anything measurable that indicates the sales performance of your company.
To calculate how far off your target you are, divide your current sales by your target and multiply by 100.

Source: Unsplash
Sell-through rate
Another key metric connected closely to your sales growth is the sell-through rate. This piece of data shows you your ability to sell your inventory before more items are received. To calculate your sell-through rate, you need to divide your sold items by your received items and multiply by 100.
Selling fewer items than you have in your inventory creates a backlogging problem. This means your product is not “getting out there,” either by virtue of being a bad product or due to poor marketing strategies.

Source: Unsplash
Luckily for you, getting out there is not as hard as it sounds. Due to the nature of E-commerce and people’s insatiable hunger for content, content marketing is one of the strongest E-commerce solutions, especially when paired up with predictive sales and marketing performance analytics.
With that said, there are many those who would call themselves the best content marketing service providers, and with the credentials to do so. So, if your product is struggling in that regard, there are plenty of those that can help you get that exposure.
Sales by region
Sales by region are one of the analytical procedures to perform on sales in order to calculate how well your company is doing in different parts of your country, or the world as a whole.
The metric is self-explanatory – it simply tracks the number of sales and the revenue for those sales in a given region. This is mostly used by larger companies that sell in multiple different locations in their respective country, but it has become a vital piece of sales and marketing performance analytics for international businesses.

Source: Unsplash
By analyzing different regions, an international corporation can see which products sell the best in which region of the world and which marketing ploys work the best, and then adjust their practices for that particular region.
Quote to close
Quote to close refers to the ability of your business to convert a lead into a customer. In terms of importance, this metric is right up there with sales growth. A business that doesn’t convert enough leads, as well as generate new leads, is sure to stagnate.
Thus, the importance of predictive analytics for business becomes incredibly apparent, as being able to calculate how many leads you’re converting allows you to adjust your strategies to generate more leads and guide them through the funnel toward becoming your customers. To calculate quote to close, take the number of deals closed and divide it by the number of quotes sent times 100.
Sales per product
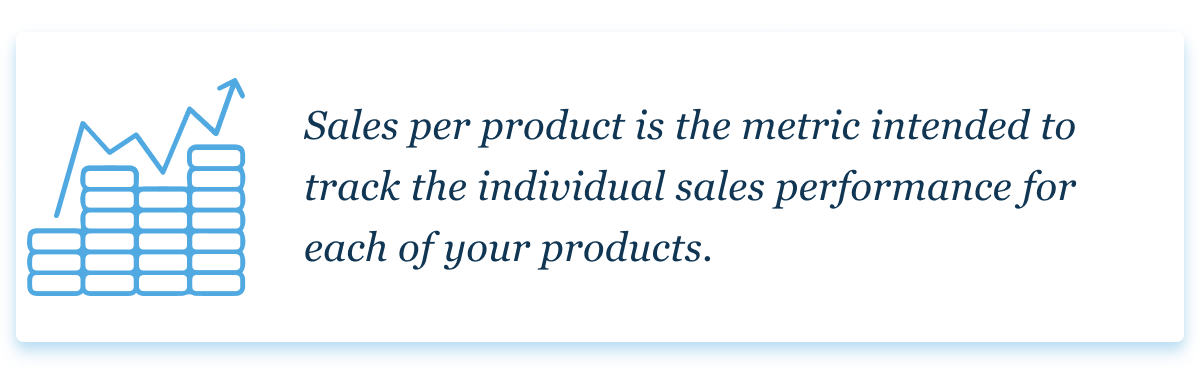
You can go about tracking your sales per product in two ways – you can either track the revenue each product is generating, or you can track how many individual products you’ve sold. The first method allows you to see which one of your products is the best money maker, and the second which is the most popular.
Owing to this metric’s simplicity, it doesn’t require any fancy tools for sales performance; Google Analytics, even the basic version of it, can handle this type of data just fine.
Pipeline velocity
Another metric with a fancy name that is much simpler than it initially sounds, but a key feature of sales performance predictive analytics. Pipeline velocity, basically, calculates the amount of money that’s going through your pipeline per day for a concrete period of time.
The formula is a little more complicated here: you need to multiply your sales-qualified leads in the pipeline by the average deal size, then multiply that by your overall win rate (amount of qualified leads turned customers), then divide it all by the length of your sales cycle.
This metric is one of the most important analytical procedures to perform on sales, as it allows you to make accurate forecasts and concrete plans.
How to create analytics for sales performance
Now that we know what metrics to pay attention to, let’s look over some considerations that will help us create an analytics template for sales performance.
Identify your objectives
The first and foremost thing we have to do is identify our goals, or, as we mentioned, a sales target.
Identify the frequency of data analysis
Basically, this step boils down to determining the timeframes we want to focus on. Monitoring data constantly is a big endeavor, so it’s better to divide the time around specific events. By creating these segments, we’re more easily able to identify any anomalies in the data and predict future anomalies.
Sales performance management software and analytics software
Working with big data is a demanding task. That is why appropriate software is a must for any serious business looking to track its sales performance.
With that being said, there are plenty of tools out there that can do the job. You might not need the most powerful software on the market, and your small online store might just be satisfied with basic tools measuring sales performance like Google Analytics.

Source: Unsplash
On the other hand, larger companies generate more data and will need a more powerful software. Such companies often employ tools powered by AI, giving them an immense potential for analyzing incredible amounts of data.
Sales and marketing analytics with artificial intelligence is becoming ever more present on the analytics stage, and AI and machine learning are making a serious push toward becoming an industry standard.
To analyze sales data effectively, forecast trends, and extract actionable insights, one needs to collect data from multiple sources, clean and analyze it. To give a helping hand with it, one can develop a custom data analytics solution for fast data collection and analysis, and real-time insights into various sales cycle aspects.
Take a look at the key benefits of modern data analytics solutions:
- Customer segmentation
- Past sales analytics
- Trend forecasting
- Sales forecasting
- Price optimization
- Customer churn prediction, etc.
When you’ve got a direct insight into trends, past sales, and customer data, the chances of making the right marketing and sales decisions are higher. The right solution can impact the success of your sales team and boost revenue.
Apply your analytics results
Finally, sales analytics mean nothing if you don’t actually apply that knowledge. Being able to analyze large amounts of data gives you incredible control over the future of your business, as you’re now able to accurately identify trends and anomalies.
Ultimately, this is what analytics is for. Before, we didn’t have access to all the tools we have now, and companies often had to take gambles and go in blind into a campaign, hoping that something would come out of it.
Nowadays, things are a lot more competitive than in the past, and having a proper sales analytics system in place will give you that much-needed edge.
Final words
And, there you have it, the boogeyman that is sales performance analytics explained. As you’ve seen, most of the metrics used to track your progress and the considerations when setting up an analytics system are rather common sense. The key here, however, is getting the right tools and people for the job.
Knowing what your goal is and what you’re trying to achieve with your business, setting realistic goals, and working meticulously towards reaching them is essential. Sales analytics is just there to give you a helping hand.
Author bio
Travis Dillard is a business consultant and an organizational psychologist based in Arlington, Texas. Passionate about marketing, social networks, and business in general. In his spare time, he writes a lot about new business strategies and digital marketing.
Empower your sales with AI
Need to adopt AI for better sales and marketing initiatives? Contact our tech consultants to discuss your business challenge.