Floods are among Earth’s most common and most destructive natural hazards. Floods occur when water overflows the land that is normally dry. Excessive rains can also lead to dams rapture or simple water overflow, which causes unwanted consequences for downstream settlements and unoptimized electricity production. Most floods take hours and even days to develop, giving residents and dam workers time to prepare. Other floods generate quickly and with little warning. These flash floods can be extremely dangerous, sweeping everything in their path. That is why it is vitally important to be able to predict such rainfall events.
However, due to extreme patterns of rainfall events, it is pretty difficult to predict dam inflow for even a couple of hours ahead. In this article we will introduce a multilevel modeling approach that aims to predict dam inflow.
Starting Point
The main task is to predict dam inflow in the next 3 hours from a given moment. This prediction will allow to:
- Prevent flooding of downstream settlements
- Optimize electricity production
In order to proceed with the task we are given the data that contains information about rainfall events that consist of a time series of precipitation, water levels on numerous bridges upstream the river flow, and information about dam inflow at a given moment. Time series data with intervals from 10 to 30 minutes (different for every data type like precipitation or water levels) is provided for every rainfall event.
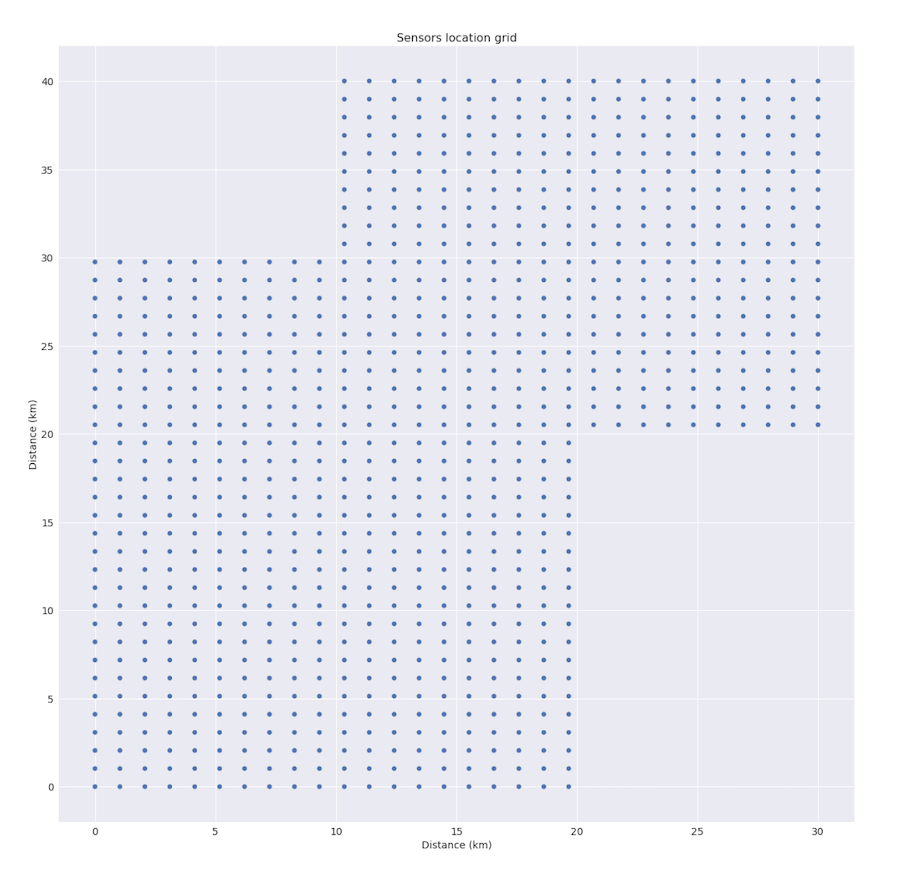
We also can use precipitation data from sensors that are located on the surface of about 900 km2 near the river basin. The region is not square, it consists of two intersecting rectangles, you can see the scheme below.
As it often happens in real life, some of the data about several bridges was missing. Some data could be missing randomly, but such situations are pretty rare. In total, available data contains about 20.000 data points for about 50 rain events.
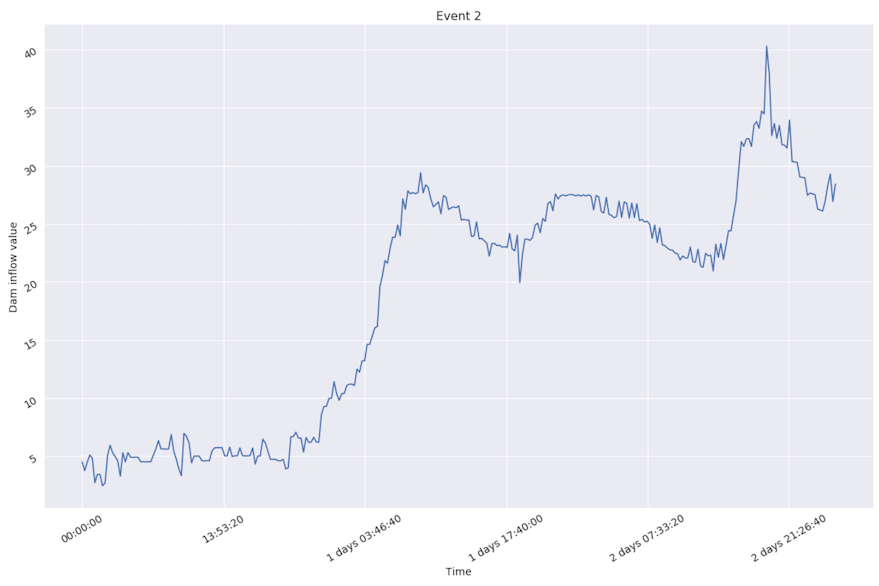
It is worth mentioning that only several events could be marked as “extreme” because water flow during them exceeds average level pretty rapidly. An example is shown below.
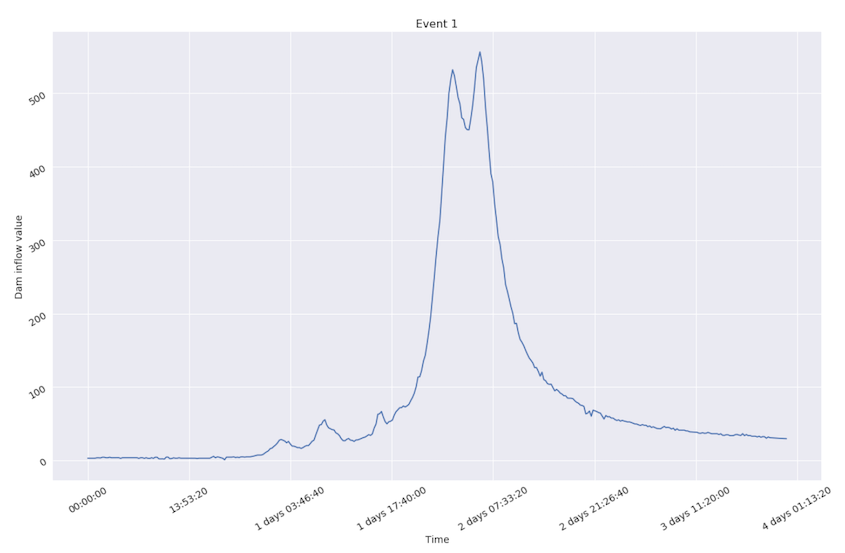
Nevertheless, the majority of events could be marked as non-extreme, because inflow value doesn’t change that fast.
After data cleaning, adjustment, visualization, and basic analysis we come to the process of choosing a validation technique that aims to help mimic real world usage. In this project we use leave-one-out technique for each event – we train the model on every event except one and calculate error for each of them.
While choosing a model it is always necessary to define the optimization objective. Since it is a regression task (predicting real value of inflow for the future) we could use any error function from regression problem. Ideally, we should also define the losses for any situation like predicting too much or too little in any range of values. An alternative (that is definitely easier than the previous one) is to figure out, whether relative error is more important than absolute, for instance, if predicting 210 instead of 200 is equally bad as predicting 20 instead of 10. After answering the question we are done with task definition and can move further. Please note, that optimizing relative errors is also useful while training linear models. This type of error makes models avoid focusing on extreme values and removes biased prediction for low inflow values.
Modeling
- A good idea is to use a simple model like linear regression as a baseline. All features and their previous values during 6-hour windows (lags) are good enough to model the dynamics of changes and make model, at least partially, understand and use these dynamics. After the model is fitted, average RMSE score that is obtained by cross validation technique equals 21.12.
- Other idea is to use a complex model such as CNN to predict inflow values based on precipitation sensor data in the region of 900 km2. Using the features extracted with convolutions along with lag features from water levels and dam inflow, potentially, should give performance boost (CNN is good at learning from spatially distributed features by using convolutional filters). However, due to data shortage CNN was not able to generalize. Also visual analysis showed, that precipitation data from the area is not very correlated with inflow values. For example, 0.6 is a correlation coefficient between target value and precipitation sums over the whole region while correlation between current inflow and target is about 0.825.
- Also we’ve tried to model sequences using RNNs that are good at modeling sequences. Data shortage became the main concern while trying out this approach. We tried a GRU, that is designed for better generalization on smaller (comparing to LSTM) datasets, but, unfortunately, it was not able to learn from data well enough to beat baseline linear model performance score.
- Decision trees ensembling methods that we tried worked with our data pretty well. They also performed slightly better in terms of RMSE metric score on validation, but gradient boosting inability to extrapolate data well enough became the limitation in our case, since it is required to predict extreme values of dam inflow. It is worth mentioning that the model performed slightly better than the baseline linear model for relatively small values of dam inflow.
- In order to overcome extrapolation limitations we proceed further with feature engineering for linear models, that are relatively fast both to train and predict. The complexity of the model could be adjusted by additional features, their interactions, polynomials etc. Features we use include finite differences, rolling sums, rolling standard deviations – all of it helps us capture inflow changes faster and perform better.
Combining our Knowledge
After experimenting with a big amount of features for linear models we got an idea of combining two types of models: one for small and medium inflow values (that could be predicted with small error by tree ensemble methods) and the other one based on linear model for predicting high inflow values by catching extreme changes in inflow. That is where multilevel modeling starts.
The particular model choice was based on the amount of data we have to train the models on: the ratio between data points with low inflow value and data points with high inflow value numbers is about 10:1.
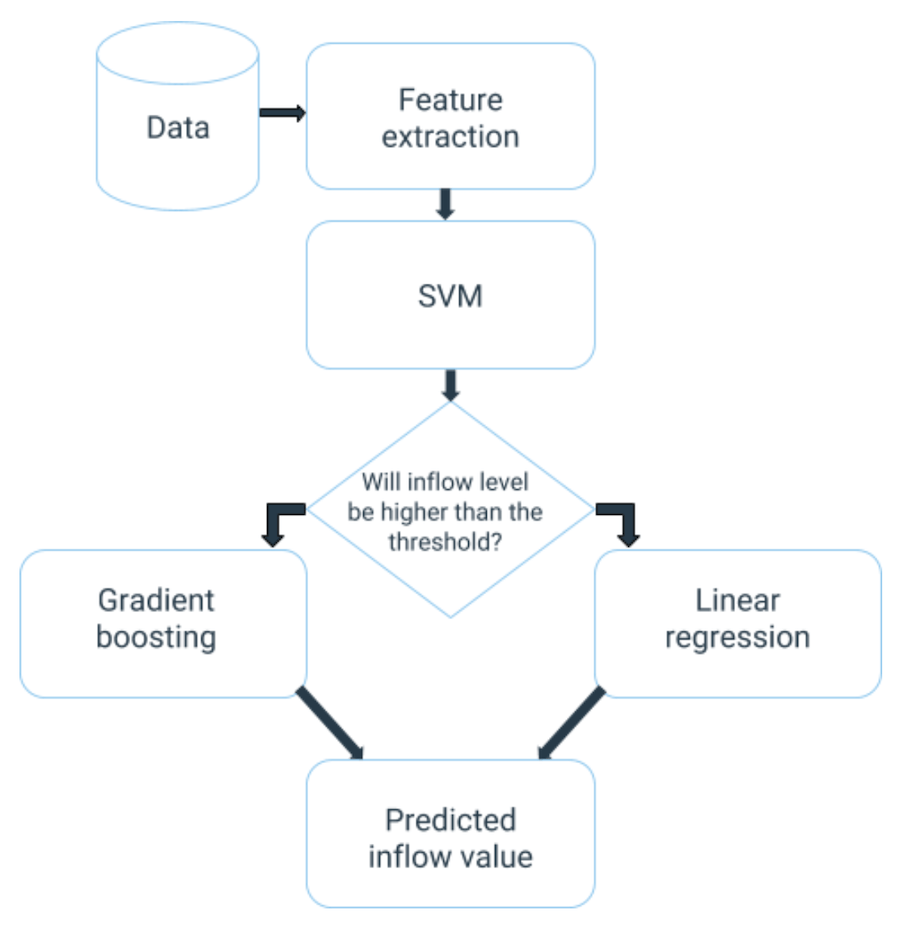
In order to implement this trick with two separate regressors for each type of events we fitted a classifier that splits points into two classes: one for low inflow value and the other for high inflow value. Points from each group are passed into corresponding regressions (gradient boosting for low inflow, linear regression for high inflow). The threshold separating low and high inflow values could be found through optimization procedure minimizing cross validation error of models combination.
Training procedure for multilevel modeling could be implemented following the next steps:
- Split data into N folds for each event.
- Fit N SVM classifiers on N-1 folds and predict whether the inflow will be high or low for the remaining one.
- Train gradient boosting on points predicted as low inflow class by N SVM classifiers on step 2.
- Train linear regression on points predicted as high inflow class by N SVM classifiers on step 2.
- Train SVM classifier on all N events at once.
Usage pipeline is shown on the graph below:
Final results: Multilevel Modeling
The main idea of our final approach is a two layer model with two “heads” that are responsible for inflow prediction. The first head is a linear regression part that is capable of predicting high inflow values events without similar experience in the past. This property of linear models makes them suitable for prediction of rapidly changing parts in rainfall events.
The other “head” of our final model is a gradient boosting regressor, that is a not straightforward model that is able to catch nonlinear dependencies in data. As a tradeoff, it requires more data and is not capable of predicting values above the maximum or below the minimum values that the model has already seen during the training phase. In our case, the model performed well for low inflow values prediction because of several reasons:
- Minimal and maximal values of target are fixed that’s why gradient boosting model is not required to predict values below minimum (that is 0) and above maximum (model’s hyperparameter);
- We have more data about low inflow values available.
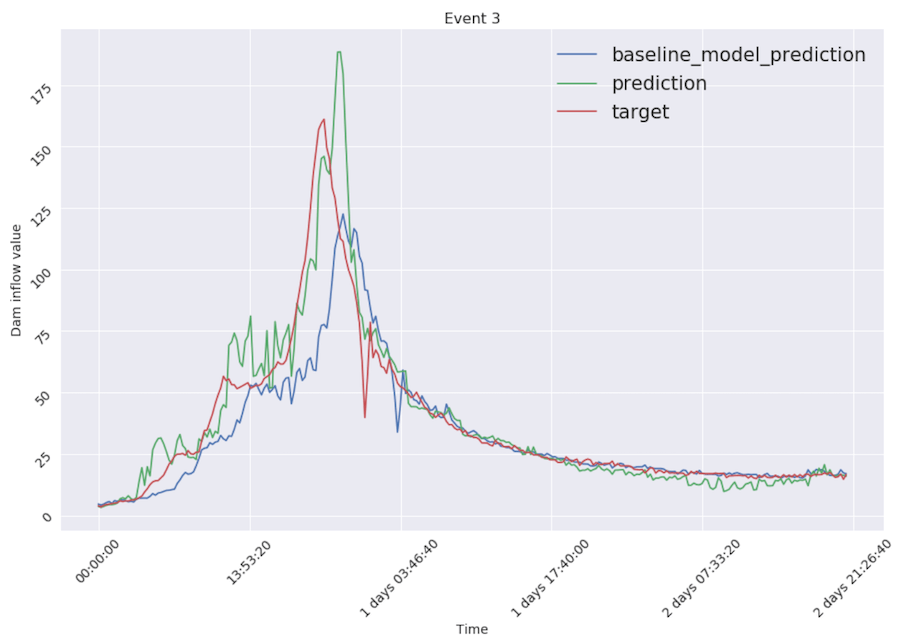
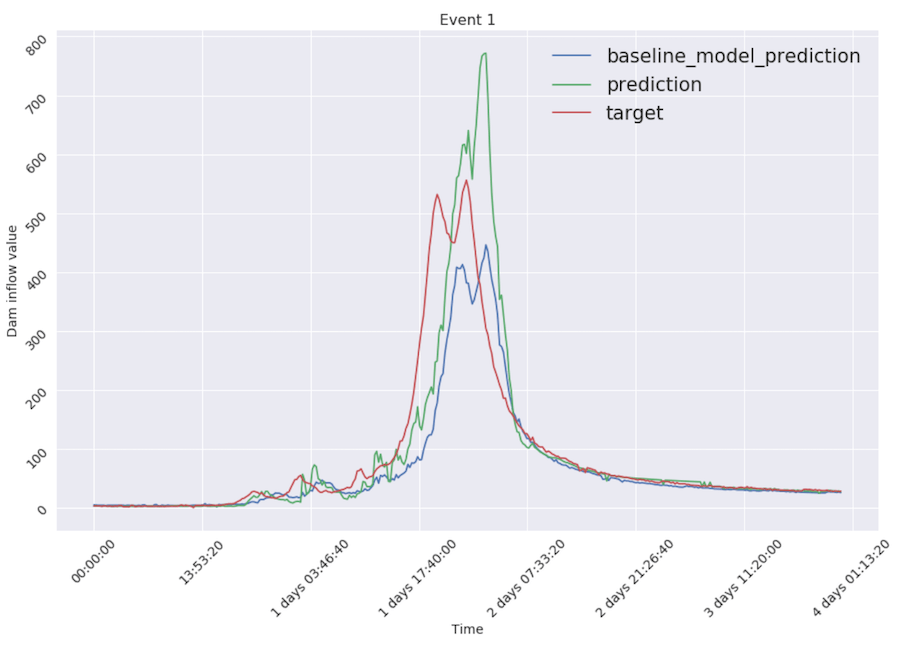
Comparing to the baseline model performance (blue line in figures), our final model (green line) lowered error almost twice. Visually, this two-headed model reacts to changes faster and, averagely, better (RMSE reduced from 21.12 to 10.87): green line is much closer to the target (red line) than the blue one.
Thanks to multilevel modeling approach our final model is capable of catching data peaks thanks to linear regression part and still performs well at low values of inflow thanks to gradient boosting.
Work with InData Labs on Your Predictive Analytics Project
Schedule an intro consultation with our Machine Learning engineers to explore your idea and find out if we can help.