In economies where the role of big data is ever-increasing, companies turn to business intelligence (BI) and reporting tools to have their data analyzed and presented in a precise and readable format.
As a data scientist, I’m always working with companies looking for actionable insights. Both large enterprises and startups today are ready to invest in BI tools and the relevant big data engineering work to explore and visualize their data.
In this article, I review an open source data visualization tool, Superset Airbnb. We used the Superset Airbnb visualization tool in one of our recent projects and it served us really well in most cases. In this article, I will tell why we chose Superset among other BI tools, what are the major benefits and drawbacks of the platform.
Selection process
We used Superset visualization in our project for a fitness mobile app with a huge fast-growing customer base. On the one hand, a BI tool was requested by business stakeholders, who needed several specific reports to monitor trend changes in application usage and better understand customer behavior. On the other hand, a BI tool could be used by our data science team to perform exploratory data analysis in relation to different user cohorts before building Machine Learning models.
We needed a tool that would satisfy the following requirements:
- interactivity. The BI users from marketing department wanted to have interactive filters on many fields of different field types, e.g., string, date, integer filters.
- no coding. Our users were mostly marketing professionals so it was supposed that all the functionality should be accessible via buttons and other controls.
- completely free! We were looking for an open source data visualization tool.

Source: Unsplash
After searching for available solutions, we selected Superset and Pentaho for further evaluation.
Superset visualization was seen as a more attractive tool for us for the following reasons:
- Superset visualizations looked more appealing to us. Both the customer and our team loved the visualizations right away.
- Superset is completely open-source and implemented in Python, while Pentaho is in Java. It was a big plus for us because we were mostly a pythonic team. And running ahead, I should say that it served us really well.
- Superset is quite a new tool, so we were interested in testing it. We were already familiar with Pentaho from the previous projects, but we were not completely satisfied with it.
Short introduction to the tool
Superset is a data exploration platform designed to be visual, intuitive, and interactive. Superset’s primary goal is to make it easy to slice, dice, and visualize data. Its developer claims that Superset can perform analytics at the speed of thought. As we have already mentioned the open source data visualization tool is written in pythonic web framework Flask.
This project was originally named Panoramix, was renamed to Caravel in March 2016, and is currently named Superset as of November 2016. Source.
Key Features
- Superset supports 30 types of visualizations
- Airbnb uses Superset with Druid, but it accepts all the data sources that support SQL Alchemy.
- configurable caching options for loading dashboards
- easy-to-use constructor for visualizations
Step by step guide for dashboard design with Superset
- Firstly, to create visualizations you provide a data source. As I’ve mentioned before Superset accepts not only Druid but also DBs that support SQL Alchemy, e.g. PostgreSQL, MySQL, SQLite.
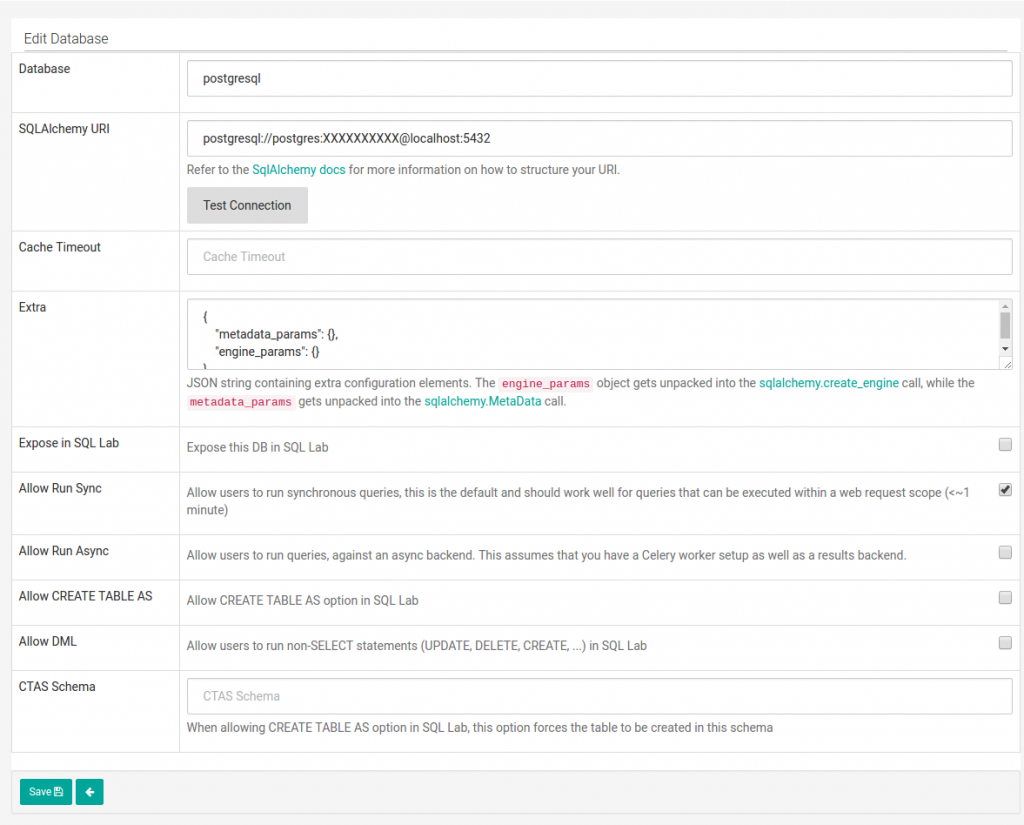
Superset allows integration of multiple data sources, but in our project, we created a single BI data warehouse that was the only data source for Superset.
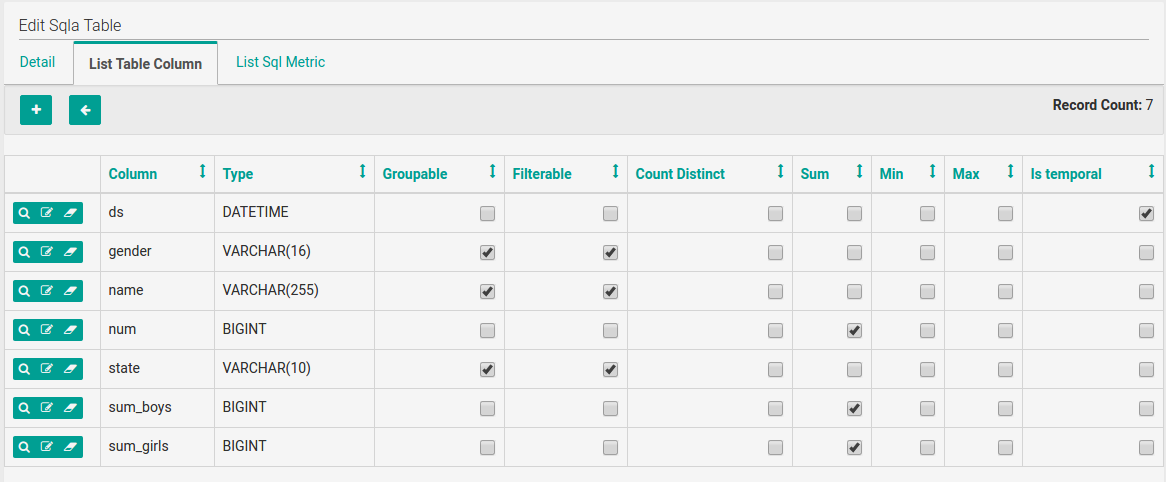
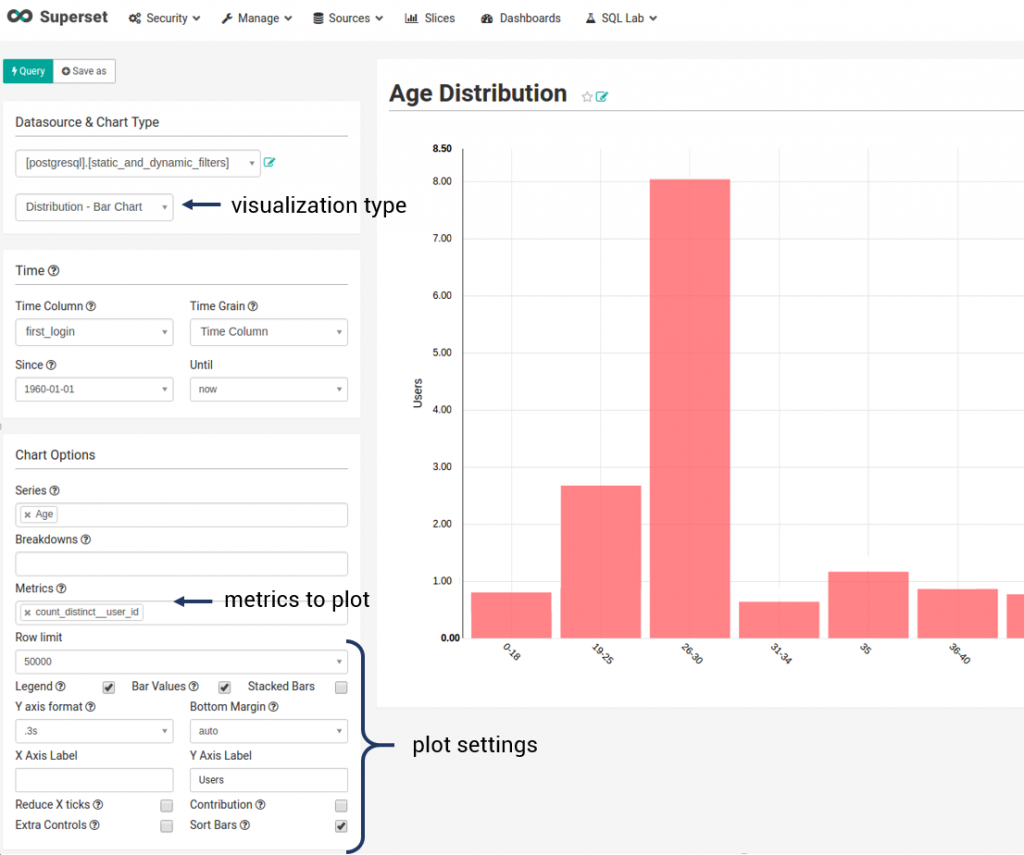
2. After you’ve added a data source, add tables from that DB and specify fields’ properties. You can specify if a field is groupable, filterable, temporal and so on. Also, you can add custom metrics (besides default ones like COUNT, COUNT DISTINCT, SUM, etc.).
3. Then you create slices. Slice is a single plot based on your data. Note that you can build slices for just one table at a time. But it’s not a problem because you can always create a view by joining as many tables as needed. Your future BI report can comprise one or more slices.
Challenges that we met
Superset worked perfectly for us when we used it to plot aggregated metrics like distribution of users grouped by OS (iOS, Android), age groups, gender, and so on. But the tool appeared to be helpless when we wanted to plot aggregations of a higher level.
For example, we wanted to count the number of workouts for each app user and then group users by counting (from 1 to 3, from 3 to 5, from 5 to 10, etc). We also needed to apply custom data filters to the dashboard, but building this functionality with Superset became a challenge for us. Creating a view couldn’t sustain our needs in that case because the result of outer aggregation depended on filtering conditions in the inner grouping.
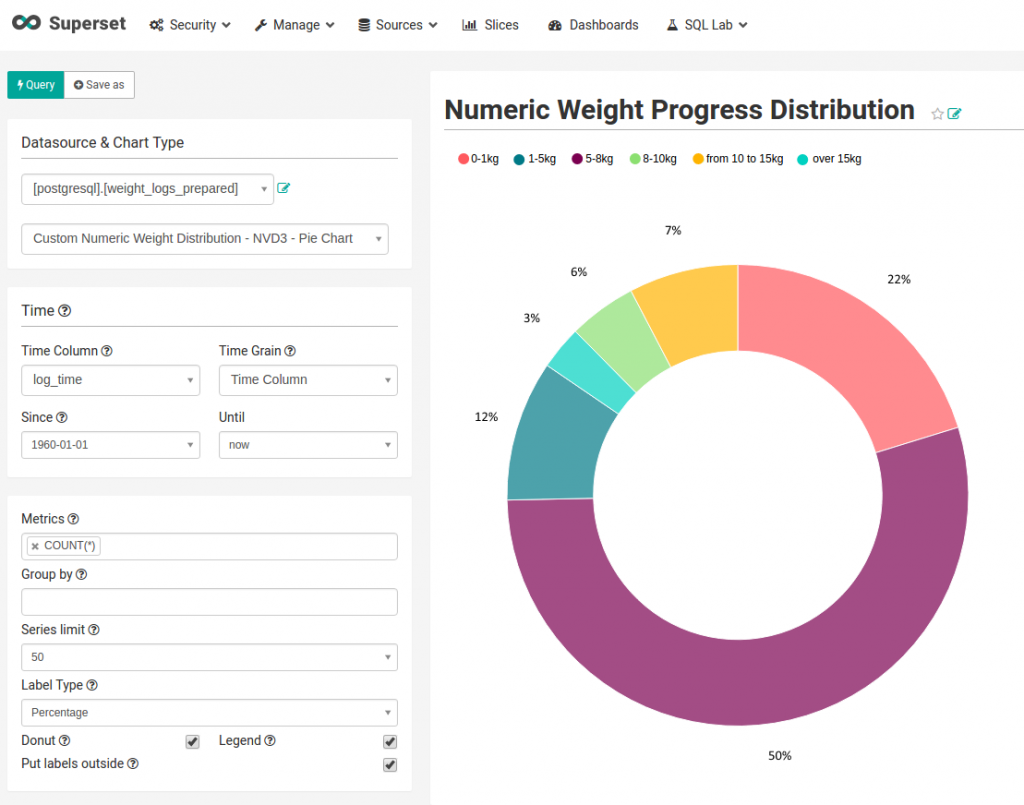
Here is another example of a task that appeared to be a problem for Superset: we wanted to plot weight loss progress (of the fitness app users) for an arbitrary period of time. The task seems to be pretty simple: you choose the last weight log in a time and subtract the first weight log during the period for each user. So we join the results of two queries which give us user_ids and weight value with ascending and descending weight log ordering according to log creation time. But Superset doesn’t allow to use JOIN clause when building a slice so we have to create custom query inside visualization type class.
Writing custom SQL query and applying interactive filters at the same time was impossible. We simply couldn’t move forward without coding custom filters… At that moment, we realized that the major benefit of Superset for us was that it was written in Python.
After a day or so of reading Superset’s source code, we found out that there was no magic in it and it worked in a simple and logical way. It parses input from controls that were specified in plot slice, then adds input from FilterBox to WHERE section in SQL query. In the case of using chains of aggregations, we had a complex query with subselects and it was not obvious for default query builder where to apply the filters.
Solution
We inherited from default visualization types but specify SQL query inside that new child class. In this query, we specify a place where filters should be added in the following way: we define __CUSTOM_WHERE_CLAUSE part in the query and then replace it with the input from FilterBox. It worked well for us and didn’t require big changes in the code.
Another solution was to use SQL Lab opportunities in Superset. But it was not an option for us because we had to provide custom filters for the end-users from the marketing department who would not write SQL queries.
A summary of benefits and disadvantages of using Superset
Benefits:
- Supports multiple data sources
- Provides various visualizations (with interactive filters)
- You can create visualizations even without knowledge of SQL
- Visualizations are really beautiful 🙂
- Fast reaction to GitHub issues from the team
Disadvantages:
- The tool is rapidly developing, so be ready to find bugs and report them to GitHub issues (we found some bugs related to non-string filters. But this has been fixed in the latest version in master branch).
- Problems with customization (if you don’t want to dive into the source code).
This’s it! Thank you for reading my post. Hopefully, it was useful for you to get to know Superset. Try the open source data visualization tool and dig deeper into its features without fear!
We regularly write about Big Data analytics, data science, artificial intelligence solutions. If you would like to read future posts from our team, then simply subscribe to our monthly newsletter. Also connect on Twitter.
Visualize your data with InData Labs!
Need help with data visualization? Contact a team of senior-level data scientists and software engineers to get help. We’ll analyze your business challenges and get back to you soon.